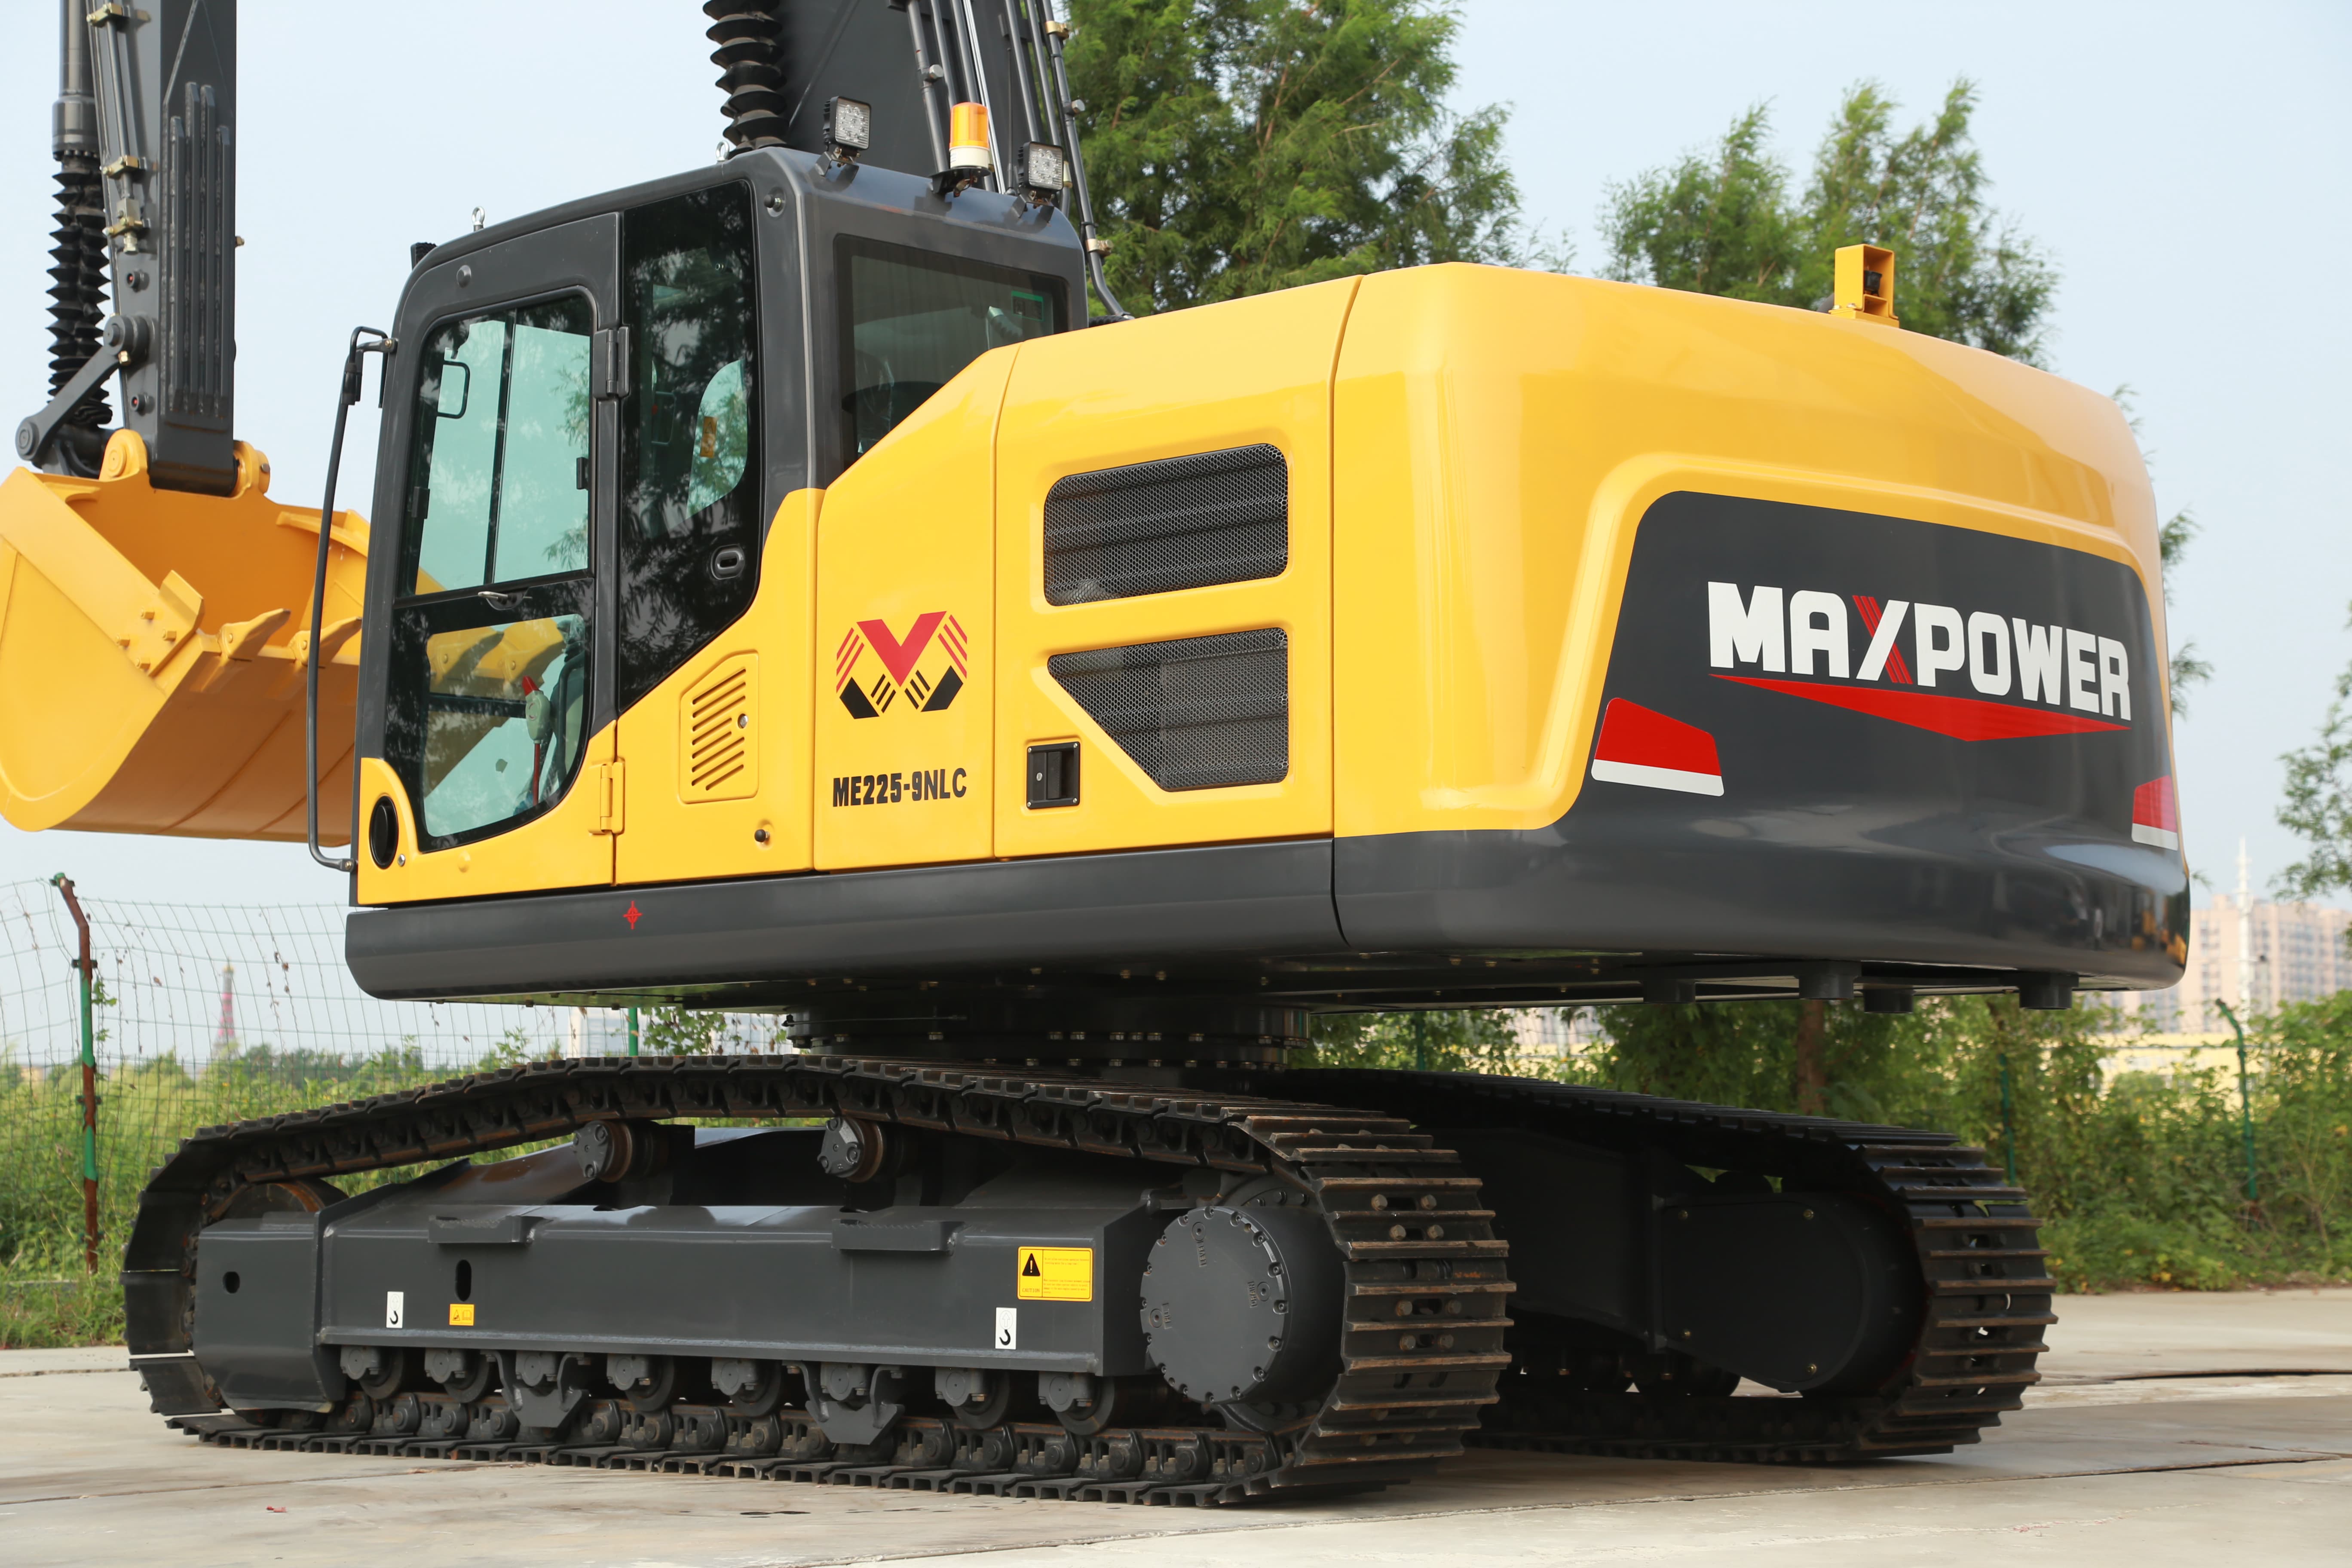
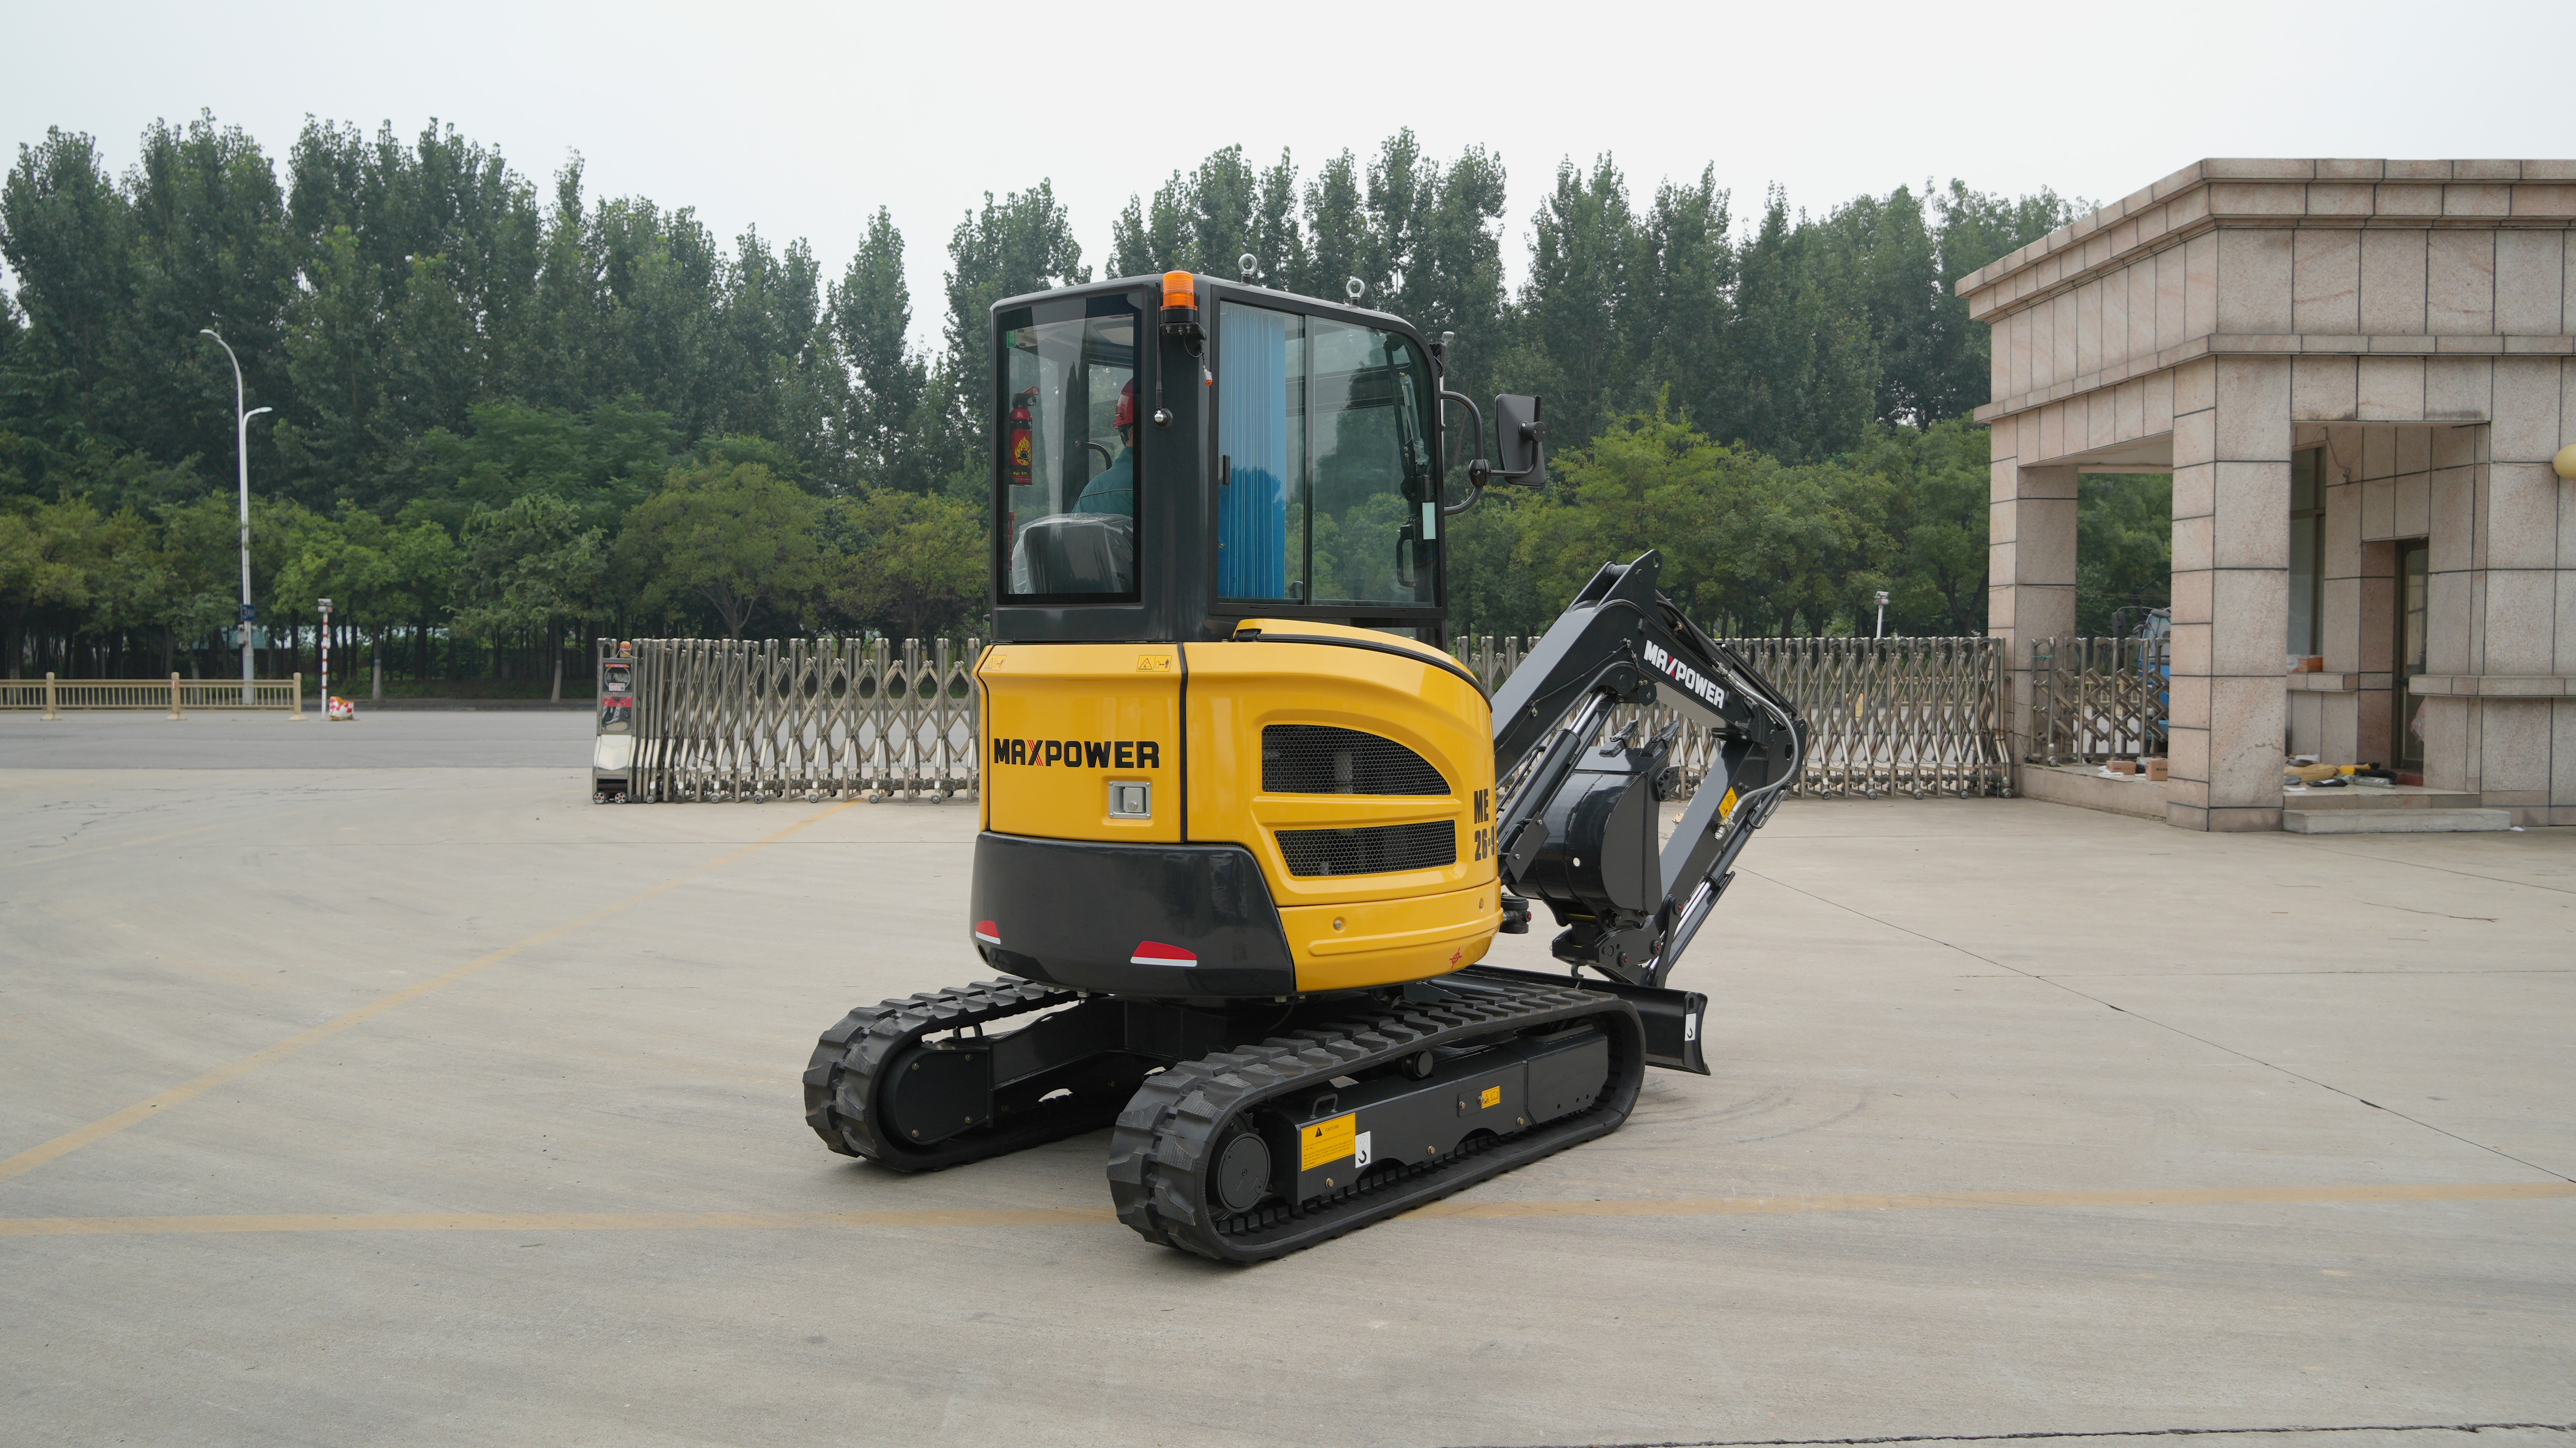
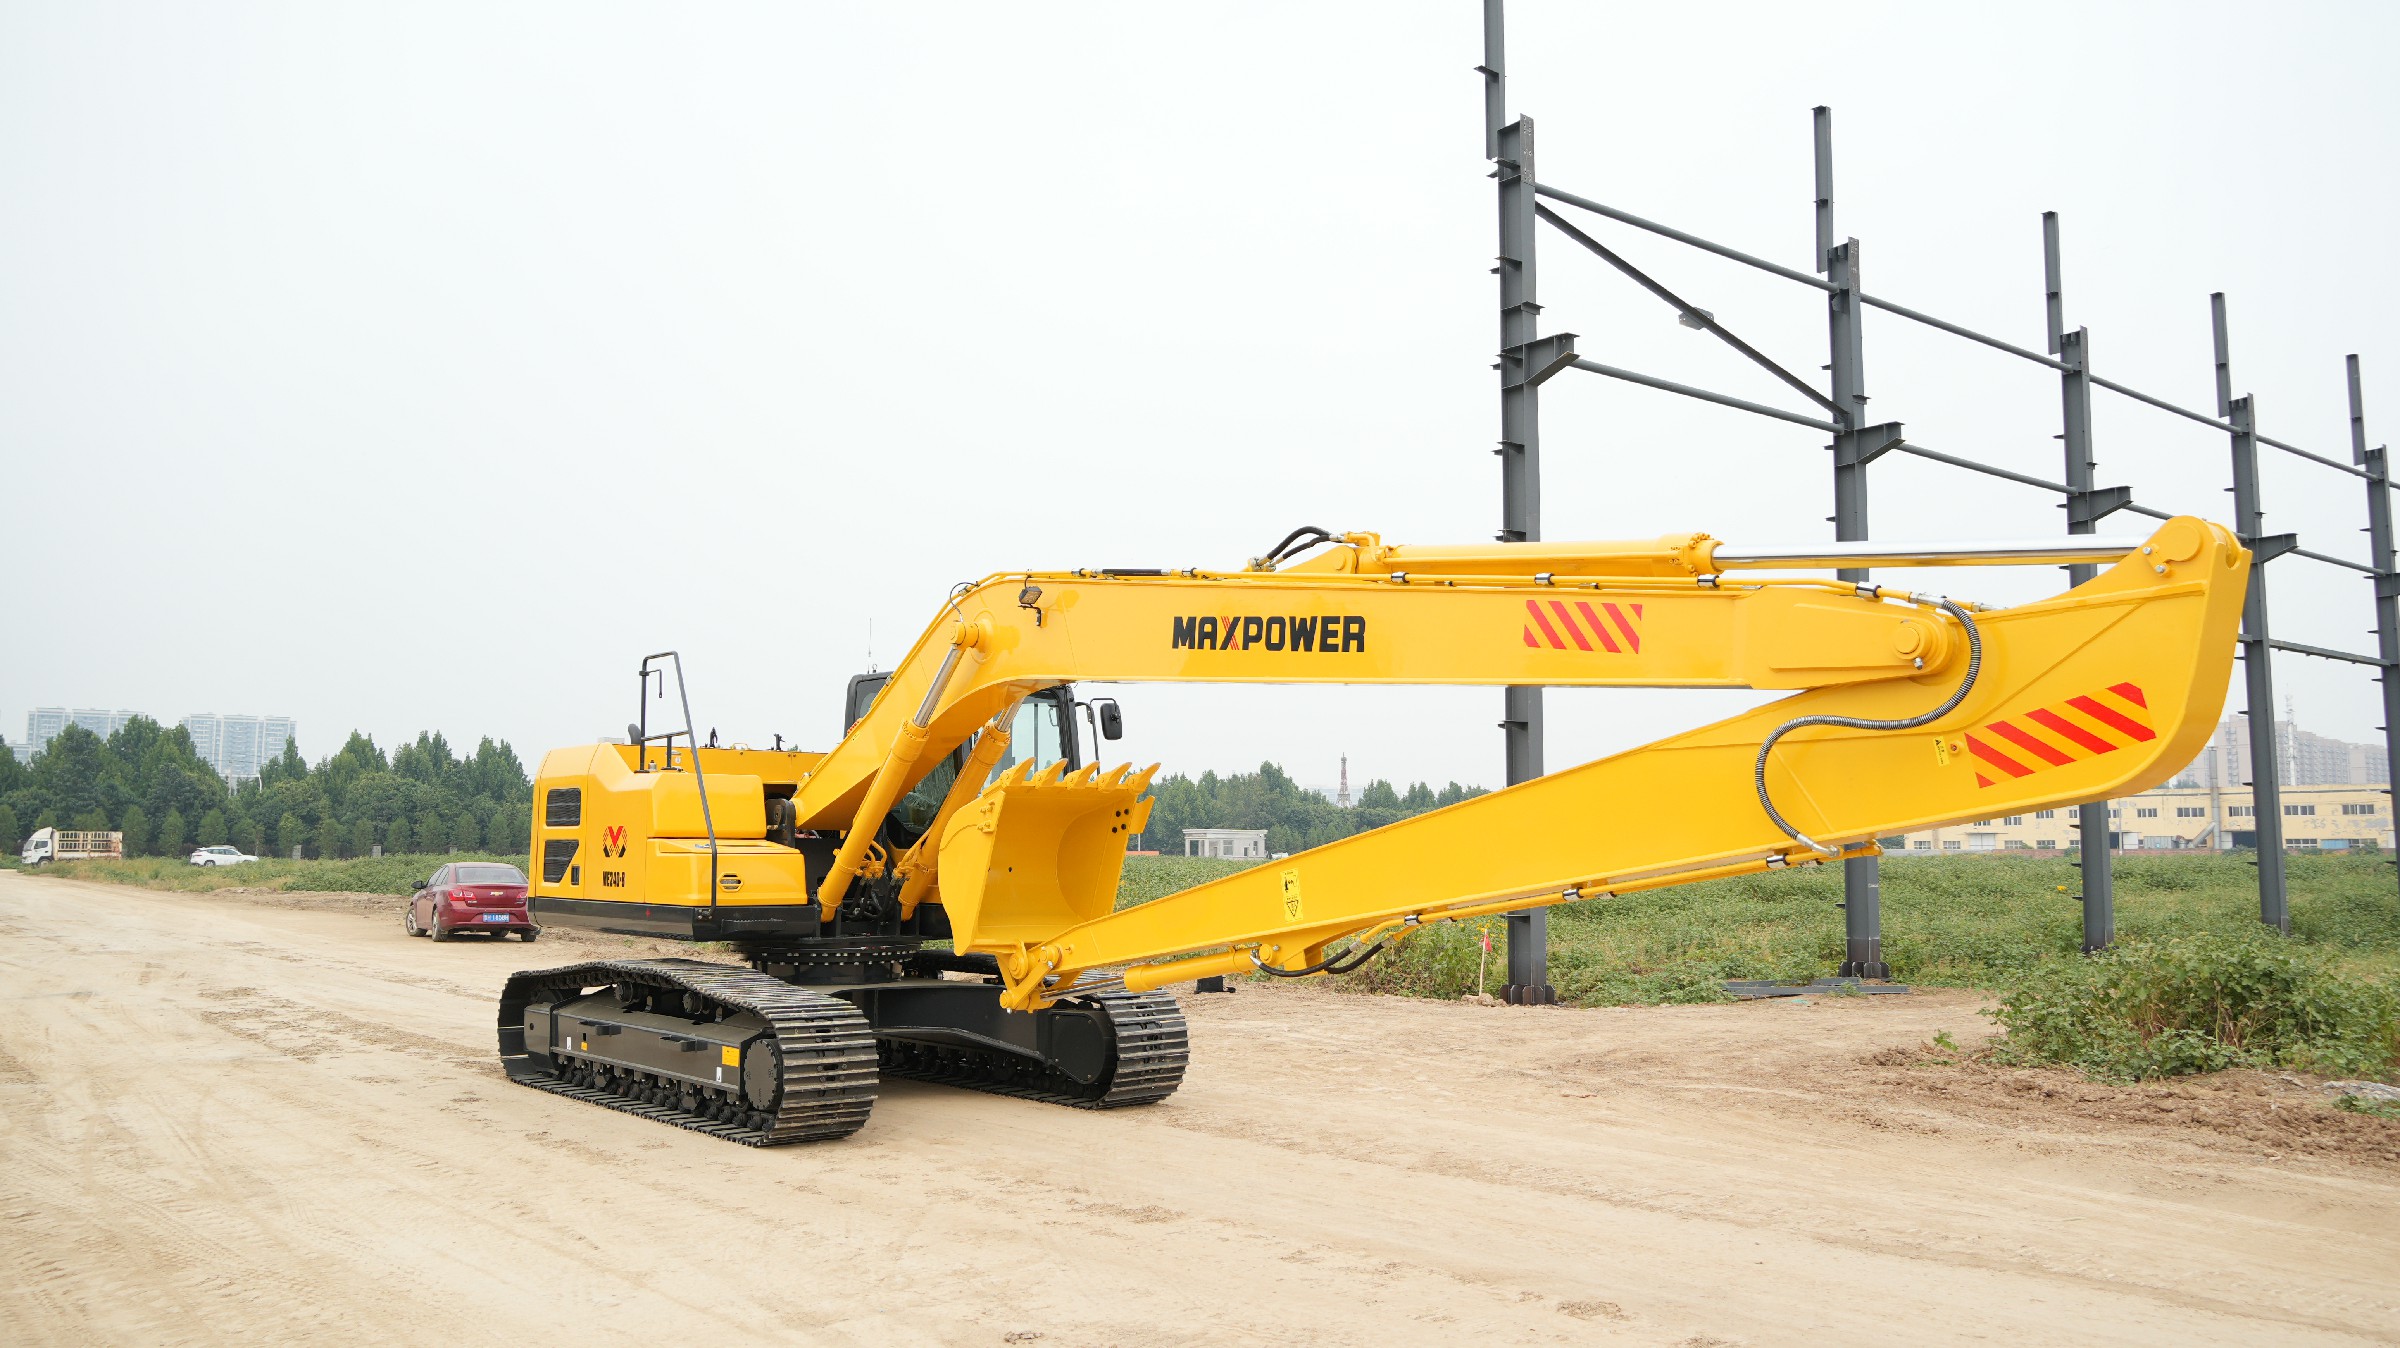
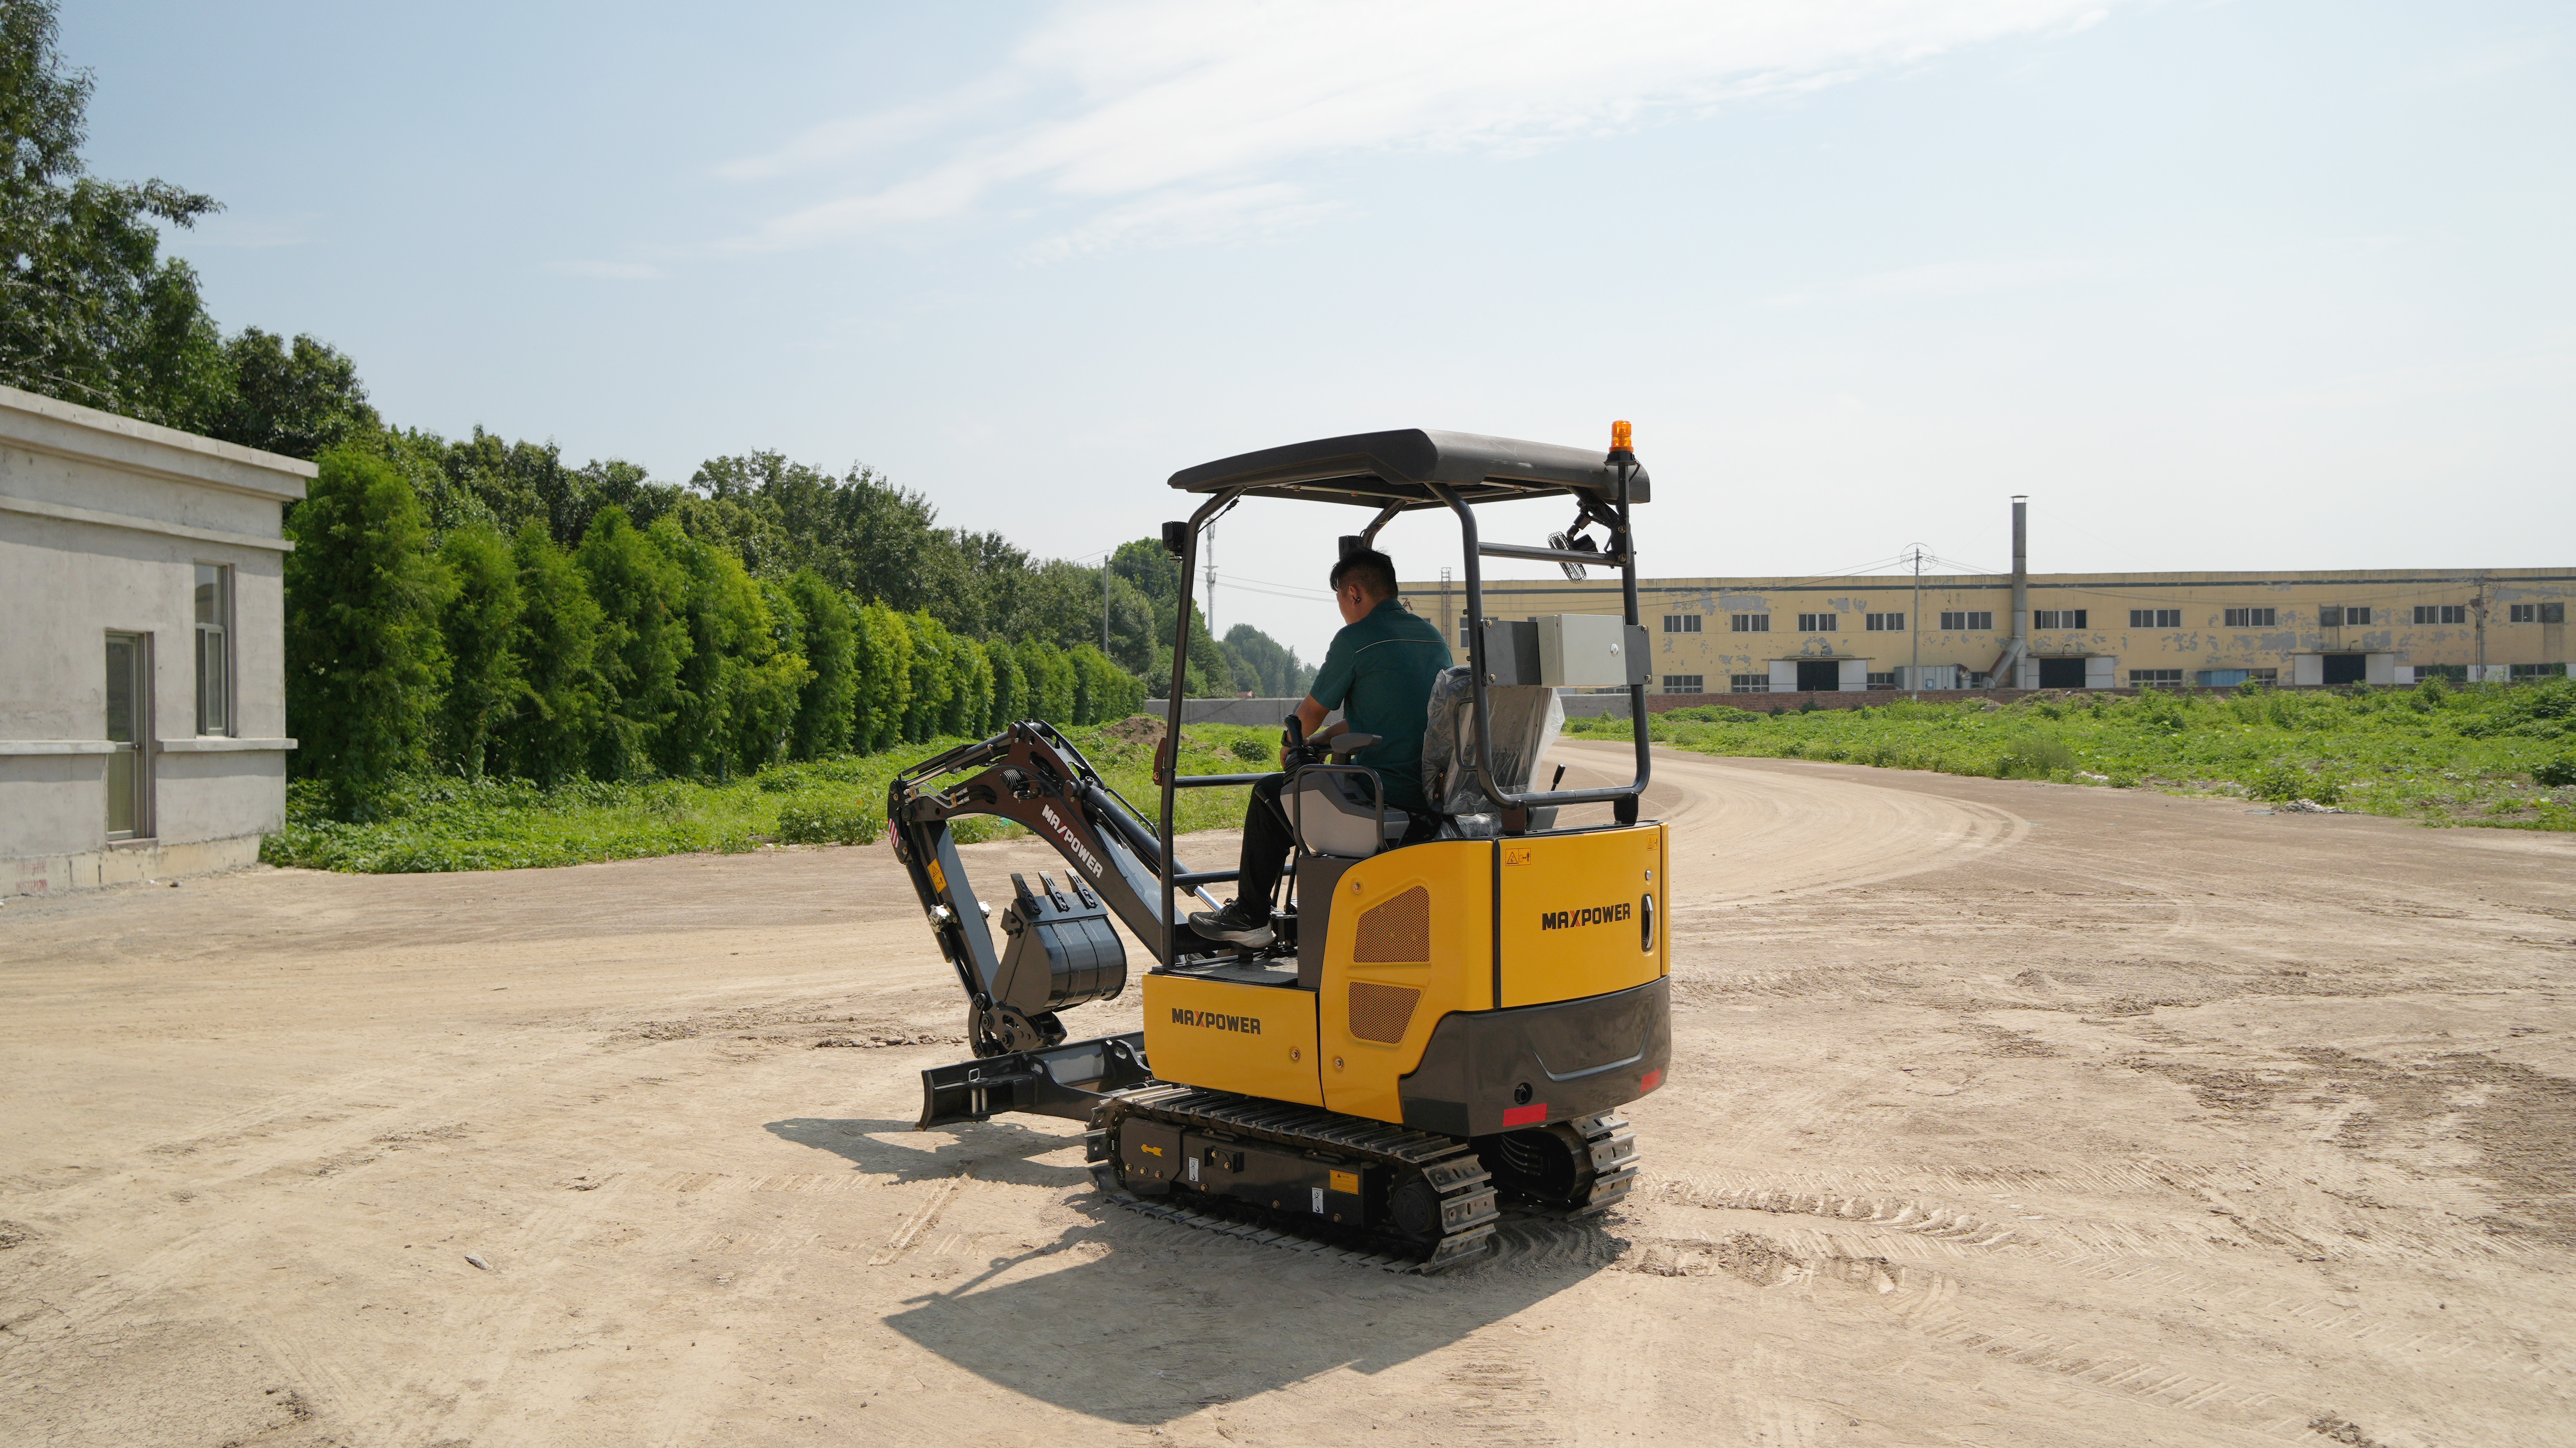
Maxpower Construction Machinery Manufacturer




Why can an excavator complete each bucket movement quickly while the loading area still falls behind schedule? The explanation may be a small bucket load, repeated repositioning, or time spent waiting for trucks. Excavator cycle time becomes useful when it is measured alongside the quantity moved and the conditions of the job.
For a contractor or equipment buyer, the practical question is how much acceptable work the complete operation can deliver over a defined period. A short demonstration helps only when the timing boundaries, payload, material, and delays are visible. Those details turn a stopwatch reading into evidence for planning or improvement.
If you are assessing equipment for a project, review the MAXPOWER excavator range and share your material, digging conditions, receiving vehicle arrangement, and required output. Ask for configuration information and a demonstration that can be evaluated using the same record format as your site observations.
Define the same start and finish event for every complete bucket cycle.
Separate digging, loaded movement, unloading, empty return, and recorded delays.
Use representative averages and retain the reasons for slow or interrupted cycles.
Combine timing with the quantity actually delivered, using consistent volume or mass units.
Count each time loss once when moving between active time and elapsed time.
Compare changes under similar conditions and check the completed work, not speed alone.
For a repeatable loading task, a cycle follows the bucket through digging, loaded movement, discharge, and return. A useful observation boundary runs from the start of one digging entry to the start of the next, provided the intervening movement includes a completed discharge. publikationen.bibliothek.kit.edu
Choose an event that the observer can identify consistently, such as the bucket beginning to enter the material. Write that definition on the record so that different observers do not start timing at different points in the motion.
Finish the cycle when the next digging entry begins. Timing only the loaded swing, or stopping when material leaves the bucket, measures one part of the work rather than the complete recurring cycle.
Loading trucks, placing spoil, trench excavation, and final trimming can involve different sequences and output measures. Keep separate records when the task changes instead of combining unlike activities into a single machine score.
Boom, arm, bucket, and swing motions may occur together. Allocate elapsed time according to the agreed task boundaries rather than adding separate component-motion times, which can count the same seconds more than once.
A useful excavator cycle time study keeps the uninterrupted clock record and identifies what happened within it. This allows the same observation to explain both the machine's working sequence and the operation's delays.
Record the digging interval until movement toward the discharge location begins. Add a short note when the operator makes repeated attempts to fill the bucket, encounters a different material, or performs a task outside the normal loading sequence.
Use the start of unloading to separate loaded movement from the discharge stage. End discharge when the empty return begins, and identify any pause within these intervals using its own start, finish, and reason.
Track the return to the next digging entry, identifying any intervening hold or interruption. For an active-time calculation, subtract classified delays from the stage in which they occurred and place them in the delay total once.
Keep total active stage time and total elapsed time in the record. Their difference should reconcile with the separately classified delays; a pause already included in an elapsed stage must not be added to that stage again.
Use one sheet or digital entry per cycle, linked to an observation-session header. The header should identify the machine configuration, bucket, operator reference, task, material, working positions, machine mode, date, and recording method.
| Record item | What to enter | Consistency check |
|---|---|---|
| Cycle and session identity | Cycle number, session reference, truck or receiving location where relevant | Connect the timing to the correct task and output record |
| Start and finish | Timestamps at the agreed recurring event | The interval contains one complete cycle |
| Digging and filling | Stage duration and relevant observations | Identify repeated filling attempts or changed material |
| Loaded movement | Duration before discharge starts | Note the movement path and any interruption |
| Discharge | Duration from unloading start to empty return | Note material sticking, redistribution, or incomplete discharge |
| Empty return | Duration back to the next digging entry | Record additional movement or repositioning |
| Delays | Start, finish, reason, and stage affected | Remove the same seconds from active-stage totals |
| Delivered quantity | Measured or estimated volume or mass, with method | Identify partial loads, carryback, and spillage |
| Full-cycle elapsed time | Finish timestamp minus start timestamp | Equals active-stage time plus classified delays |
Describe changes in digging depth, material condition, swing path, truck position, and access during the session. A timing change becomes easier to interpret when it can be connected to an observed event.
A continuous clock or time-stamped video helps preserve pauses that might disappear from selected clips. Observe from an approved location and arrange filming without interfering with machine operation or the site's movement controls.
For cycle calculations, start and finish the analysis at matching complete-cycle boundaries. Keep any partial cycles at the edges of a recording identified separately, and retain their time in any broader shift record rather than silently deleting it.
The average excavator cycle time should describe the cycles actually included in the study. Keep the cycle count, time total, and quantity total aligned to the same observation window.
Add the complete-cycle durations and divide by the number of cycles. If 120 complete cycles occupy 3,600 seconds, the mean elapsed cycle is 30 seconds; this is an arithmetic example, not a target for a particular machine.
A genuine wait, difficult bucket fill, or repositioning event belongs in the operational record. Correct a recording error when evidence supports the correction, but explain exclusions instead of removing slow cycles simply because they reduce the average.
The median can help describe a typical cycle, while the range helps reveal variation. For the observed production rate, use total delivered quantity divided by total elapsed time, since a median does not account for the complete time history.
When combining sessions, add their time totals and cycle counts before calculating the mean. Averaging two session means equally gives the smaller sample too much influence when the sessions contain different numbers of cycles.
Cycle timing becomes a production measure only when the quantity moved per cycle is also known. Keep the bucket's rated volume, actual fill, and delivered quantity distinguishable in the calculation.
Record the supplied bucket and whether the quoted capacity is struck or heaped, together with the applicable rating description. Use a fill factor defined against that same capacity basis rather than combining figures from different conventions.
For a volume estimate, average bucket volume equals rated bucket capacity multiplied by the applicable fill factor. Material condition, bucket suitability, and the actual filling result affect that input, so a catalogue capacity does not establish the volume delivered by every pass. wheelercat.com
Use appropriate payload records, weighing, surveyed quantities, or another agreed measurement method for the project. Account for partial loads, material left in the bucket, spillage, and repeated handling when reconciling bucket movements with accepted production.
Caterpillar's production analysis service description combines weight and cycle-time information with observation of the site and operating technique. The useful principle for a buyer is to request quantity evidence together with the timing record. Caterpillar
Tonnes describe mass, while cubic metres describe volume. Converting a loose-volume rate to a mass rate requires loose bulk density appropriate to the same material condition; a bucket volume is not a machine or truck payload limit.
The following constructed example demonstrates the calculation only. It is not MAXPOWER test data, an approved attachment specification, or a promised production rate, and it assumes that the estimated bucket contents are fully delivered without spillage or carryback.
Assume a 60-minute window contains 120 complete cycles, with 2,880 seconds of active cycle stages and 720 seconds of classified delays. The assumed heaped bucket capacity is 1.20 m³ and the assumed average fill factor is 0.90, giving 1.08 loose m³ per completed cycle.
The average active cycle is 2,880 ÷ 120 = 24 seconds, while the average elapsed cycle is 3,600 ÷ 120 = 30 seconds. Active cycling occupies 2,880 ÷ 3,600 = 0.80 of this particular observation window.
For the selected complete-cycle window, hourly output equals 3,600 multiplied by total delivered quantity and divided by total elapsed seconds. Starting with active-cycle time requires the active share of that same window as well, as the table shows.
| Calculation route | Calculation using the assumed data | Result |
|---|---|---|
| Complete elapsed cycle | 3,600 ÷ 30 × 1.08 | 129.6 loose m³ per elapsed hour |
| Active cycle with its time share | 3,600 ÷ 24 × 1.08 × 0.80 | 129.6 loose m³ per elapsed hour |
| Total quantity over the full window | 120 × 1.08 ÷ 1 hour | 129.6 loose m³ per elapsed hour |
Both cycle-based routes describe the same assumed quantity over the same hour. The 0.80 factor in the second route represents only the delay time excluded from the 24-second active cycle.
Multiplying the first result by 0.80 again would give 103.68 loose m³/h and would count the same delays twice. For a wider shift forecast, introduce only additional time losses that are absent from the observation being used, with their scope stated explicitly.
An excavated bucket generally carries disturbed material, while an earthworks quantity may describe material in its original position. Label the volume condition before comparing the estimated rate with the project requirement.
Bank volume refers to material in its original undisturbed state, loose volume to excavated material, and compacted volume to material after compaction. The conversion between these states depends on the material and project conditions. wheelercat.com
If swell is defined as the fractional increase from bank volume to loose volume for the same material mass, bank volume equals loose volume divided by one plus swell. Under an assumed 20% swell, the example's 129.6 loose m³/h becomes 129.6 ÷ 1.20 = 108 bank m³/h.
The 20% value is an illustration, not a suggested allowance for all soils or rock. Obtain an appropriate conversion basis for the project, and avoid applying swell again to quantities already measured or reported as bank volume.
Fill factor describes the volume carried relative to the stated bucket capacity. Swell converts between material volume states, so the two factors answer different questions and should occupy separate fields in the estimate.
A stage breakdown helps locate where an investigation should begin. Treat a long interval as an observation to explain, because different causes can produce similar stopwatch results.
| Observed pattern | Questions to investigate | Evidence to retain |
|---|---|---|
| Digging takes longer | Has the material, depth, bucket filling result, or digging position changed? | Material notes, working position, filling attempts, and delivered quantity |
| Loaded movement increases | Has the discharge position moved or the travel path become more complicated? | Layout sketch, receiving vehicle position, and movement timestamps |
| Discharge becomes irregular | Is material sticking, being redistributed, or remaining in the bucket? | Discharge observations and any carryback or spillage |
| Return time varies | Are additional movements, repositioning, or pauses occurring? | Event sequence with active movement and delay separated |
| Elapsed time rises while active stages remain similar | Are vehicle availability, spotting, access, or downstream interruptions responsible? | Delay reasons and corresponding vehicle or site records |
Caterpillar's bench loading guidance discusses the influence of swing distance, working position, and truck placement. Use these as subjects for a site review, with any proposed layout change checked against ground conditions, clearance, and the approved operating arrangement. Caterpillar
Repeated movements or poor vehicle coordination may explain a longer cycle without identifying a machine defect. If several functions become unexpectedly slower under comparable conditions, retain the operating details and request a service assessment rather than diagnosing a hydraulic fault from cycle time alone.
Write “waiting for receiving vehicle” when that is what the record shows. Assigning responsibility or proposing a technical repair requires additional evidence beyond the duration of the wait.
A bucket cycle sits within a larger loading and transport process. A machine can have repeatable active movements while the overall operation loses time between vehicles or at the destination.
Record bucket-cycle time separately from the time required to load a complete truck and the truck's full haul cycle. Define whether truck-loading time includes arrival, spotting, exchanges, or departure before comparing figures from different reports.
The ME390 truck loading guide addresses equipment specifications and loading-system considerations. Use this cycle study to add evidence from the actual arrangement, showing where bucket activity, vehicle movements, and waiting overlap. maxpower-group.com
Check whether waiting originates at the loading area, on the haul route, or at the discharge point. Volvo's site analysis explanation separates queueing, spotting, travel, and dumping in the hauler cycle, illustrating why fleet records need more than one stopwatch total. Volvo CE United States
A comparison becomes useful when it shows both the result and the conditions that produced it. Faster timing after a change does not, by itself, establish that the change caused a sustainable improvement.
Record the current task, attachment, material condition, digging depth, movement path, operator reference, and machine settings. Include delivered quantity and delays so that the baseline describes the operation rather than a selected sequence of quick movements.
Compare an agreed layout adjustment or operating arrangement while keeping other conditions reasonably similar. If the material, operator, bucket, or working depth also changes, state those differences before interpreting the result.
Collect further windows when performance varies or the job includes different recurring conditions. There is no single sample count that establishes representativeness for every site; report the number of complete cycles, the elapsed observation time, and the conditions covered.
A faster cycle can coincide with a smaller load, additional spillage, or more rehandling. Compare accepted output per elapsed hour and the required quality of the work before judging whether the operation improved.
Digital records can support a cycle study when their measurements match the question being asked. Engine hours, idle time, working time, bucket counts, and payload estimates are different data fields and should not be treated as interchangeable.
Ask which signals identify a cycle, whether load quantity is estimated or measured by another method, and how timestamps and reporting periods are defined. Follow the relevant system's calibration and operating instructions, and record any limitations affecting the observation.
Repeated handling, partial dumping, or movements within the same stockpile can affect what a digital total represents. Compare a sample of system events with an observation record before treating every recorded movement as new project output.
The Cat Payload for Excavators description explains sensor-based payload calculation and settings intended to reduce counting errors during material handling. This is an example of one manufacturer's system; available functions, equipment requirements, and data definitions must be checked for the machine actually being assessed. Caterpillar
The most useful report identifies a specific loss, an evidence-based action, and a way to check the result. Avoid turning every slow interval into a separate proposed adjustment before the main constraint is understood.
Summarize how much observed time each delay category consumes and how often it occurs. A recurring vehicle wait may deserve attention before a small difference in empty-return speed, depending on its contribution to the complete operation.
State the proposed action, the person responsible for reviewing it, and the conditions under which the next observation will be made. Retain the original record so the comparison can be checked against the same definitions.
Present elapsed production rate, cycle count, quantity basis, active-stage totals, delay totals, and relevant site differences together. If the sample covers only steady loading, describe it that way instead of presenting it as a verified whole-shift rate.
Keep the timing sheet, quantity record, layout sketch, and permitted video references together. This makes later equipment discussions more concrete and allows another reviewer to understand how the reported rate was calculated.
There is no single cycle time that defines good performance for every excavator and task. Material, digging depth, movement distance, attachment, payload, and delays all affect the result. Establish a representative baseline for the actual operation, then compare delivered quantity and elapsed time under similar conditions.
Use the same clearly observable event at both ends, such as the beginning of bucket entry into the material. The interval should include the following digging, loaded movement, discharge, and return before the next entry begins. Write the boundary on the timing sheet so different observers can apply it consistently.
Include waiting when reporting the full elapsed-cycle average, and identify it separately when calculating active-cycle time. Both measures can be useful if their definitions are clear. If an elapsed average already includes a particular delay, do not apply another efficiency deduction for the same lost time.
Divide 3,600 by the average cycle duration in seconds, while keeping the time basis explicit. An active-cycle average gives a rate per active hour; an elapsed-cycle average includes the delays within its observation window. Multiply by a supported quantity per cycle only when both inputs describe the same operation.
Rated capacity provides a starting volume basis, but it does not prove the quantity delivered on every pass. The estimate also needs a compatible fill factor and an allowance for actual discharge conditions. Where practical, reconcile it with payload, weighing, or surveyed quantities from the same observation window.
A shorter cycle can move less material if the bucket fills poorly, spills material, or requires repeated handling. Compare the total useful quantity delivered over the full elapsed period, together with the required work quality. A timing improvement becomes valuable when the completed output supports the same conclusion.
Loose volume describes excavated material, while bank volume describes material in its original position. With swell defined as the increase relative to bank volume for the same mass, divide loose volume by one plus the swell fraction. Use a project-supported factor and label the volume state beside every reported rate.
Use enough repeated observations to capture the recurring conditions and variation relevant to the decision. No universal cycle count makes every study representative. Report the complete-cycle count, observation duration, material and task conditions, and exclusions; collect additional windows when important conditions remain uncovered.
It depends on the installed system and its data definitions. Some records describe engine activity or idle time, while others can include payload or working events. Check the available fields, calibration requirements, counting rules, and observation window, then compare a sample with the actual task before relying on automated totals.
Provide the intended task, material condition, required output, machine and bucket configuration, working layout, and receiving vehicle arrangement. Add a timing record with clearly defined stages and delays, plus the method used to establish quantity. This gives the discussion a shared basis without assuming a universal production rate.
Excavator cycle time is most useful when it connects an observable sequence with an honest quantity and time record. A repeatable study can show whether attention belongs on filling, movement, discharge, vehicle availability, or the wider site arrangement.
Bring the same evidence into a MAXPOWER equipment discussion: material and task details, configuration, working geometry, required output, and matched timing and quantity records. For an existing machine with an unexpected change in operation, use MAXPOWER repair support to request a review with the relevant operating observations.